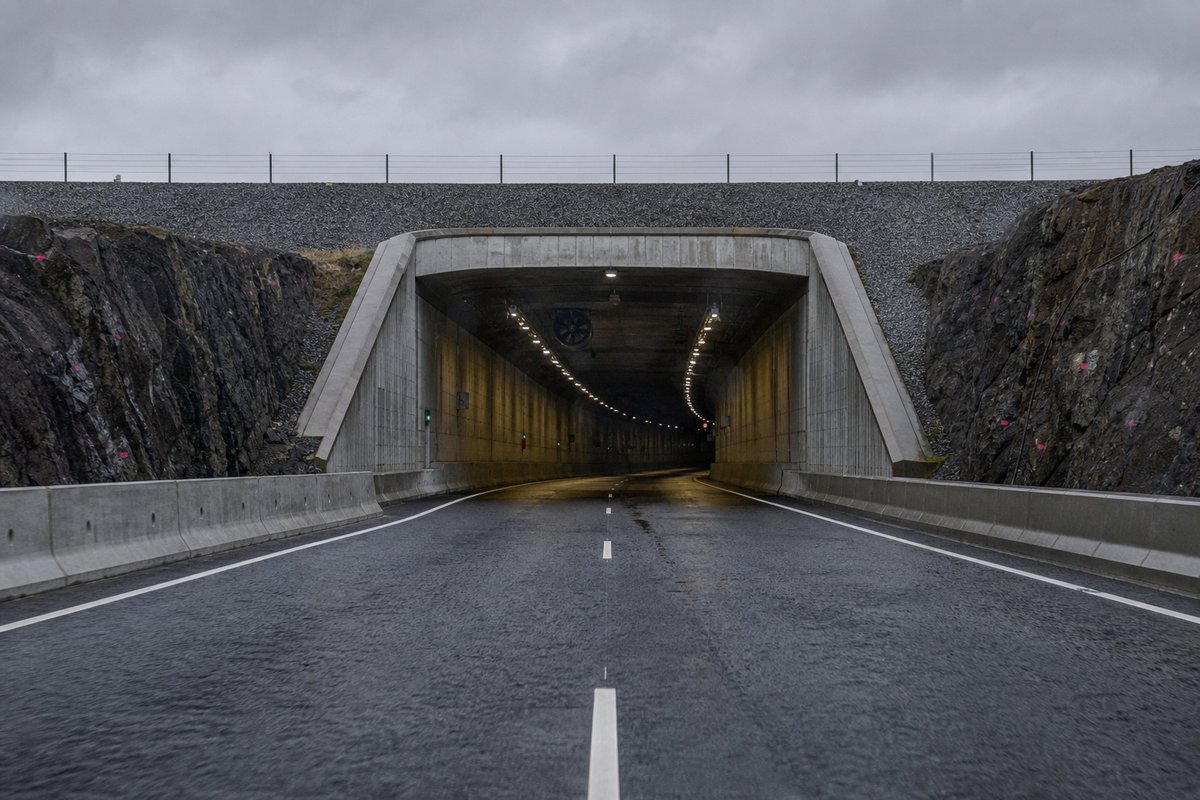
The median entry measures 0.46 km, so half the table sits below that and half above, which is a better guide to the typical structure here than the headline figure. The shortest recorded entry is 0.18 km against 3.52 km at the top, a spread of 19.78x across the same table.
The middle half of the table runs from 0.29 km to 0.7 km, and that band is where most of the engineering on this page actually sits. Between the longest and the tenth-longest the drop is 3.34 km, which is the part of the table that changes when a single scheme opens.
Dated entries run from 1969 to 2000, and the busiest decade is the 1960s with 2 recorded openings. The table on this page runs to 10 rows and records State, Tunnel, Length (m), Date of opening and Region for each of them, which is the shape the original compiler chose rather than one imposed here.
- 10entries listed
- 3.52 kmlongest bore
- 1969–2000openings span
- 6.1 kmtotal length
The record table
How this archive measures: lengths, bores, dates and ordering
| State | Tunnel | Length (m) | Date of opening | Region | Notes | Road |
|---|---|---|---|---|---|---|
| DK | Drogden | 3 520 | 01.07.2000 | HOV | Second tube: 3520 m / Ö resund link, immersed part | E 20 |
| DK | 3. Limfjord | 1 040 | PRJ | JUN | Selected alternative 3 west of Aalborg | |
| DK | Harbour | 950 | PRJ | HOV | ||
| DK | Tårnby | 700 | 2000 | HOV | Second tube: 700 m | E 20 |
| DK | Limfjord | 582 | 06.05.1969 | JUN | Immersed tunnel | E 45 |
| DK | Guldborgsund | 460 | 1988 | ZEA | Immersed tunnel | E 47 |
| DK | Th.B. Thrige | 400 | PRJ | SYD | Town Odense, C&C | |
| DK | Fredrikssundsvej | 367 | 1969 | HOV | Also called Hareskov | |
| DK | Lufthavn | 292 | HOV | E 20 | ||
| DK | Bernstoffsvej | 178 | 1972 | HOV | E 20 |
| — | Region | Main Town |
|---|---|---|
| SYD | Syddanmark | Vejle |
| ZEA | Zealand | Sorø |
| — | Provinces | Main Town | Reg. |
|---|---|---|---|
| RK | Ringkøbing | Ringkøbing | JUC |
| RO | Roskilde | Roskilde | ZEA |
| SJ | Sønderjylland | Åbenrå | SYD |
| ST | Storstrøm | Nykøbing | ZEA |
| VE | Vejle | Vejle | SYD |
| VJ | Vestsjaelland | Sorø | ZEA |
| VI | Viborg | Viborg | JUC |
How this table is compiled
Where one of these 7 lengths disagrees with an operator's own figure for Denmark, the table keeps the published value and notes the difference instead of averaging the two. The 7 rows for Denmark are ordered by length, not by date, so the 2000 opening sits well down the table without being any less current.
Lengths for Denmark are recorded in metres which is how the operators publish them and why the shortest entry here reads as 178 m and not a rounded figure. The longest entry is 19.8 times the shortest and 7.7 times the median, which is the quickest measure of how uneven the table is.
Dates for Denmark refer to opening to traffic, not breakthrough, so the 1969 entry was under construction for some years before that. Laid end to end the entries on this page would run 6.1 km, which is a number with no engineering meaning but a useful sense of the scale of what is catalogued.
The dated entries carry 4 distinct opening years across 31 years, and the median opening year is 1988. Read down the length (m) column, the 10 values run from 178 m to 3 520 m with a midpoint at 521 m; the spread rather than the maximum is what says how uneven this set is.
The tunnel column names 10 distinct entries on this page, Drogden and 3. Limfjord among them, each traceable to the operator or administration record it was taken from. The road column sorts these 6 rows into 3 groups, the largest being E 20 with 4, then E 45 with 1 and E 47 with 1.
Reading the figures
The table below lists 10 entries with a recorded length, each giving a name, a length in metres and, where documented, the year of opening. A new scheme in Denmark would have to beat 3.52 km to change the head of this table, and that is the figure worth rechecking when one opens.
Second and third place go to Tårnby at 0.7 km and Limfjord at 0.58 km. 7 of the 10 rows carry an entry in the notes column — 70 per cent of the table — and that column is where the qualifications live: tube counts, closures, boundaries and the reason a figure reads the way it does.
Further down the table, Fredrikssundsvej is recorded at 0.37 km and Lufthavn at 0.29 km. A tunnel list for Denmark reads differently from a neighbouring country's: 1 of these 7 structures pass three kilometres, and the same journey time is bought with one long bore in one country and a dozen short ones in another.
3 of those 10 are recorded as under construction or planned, the longest of them measuring 1.04 km, so the count includes them while every measured figure — the range, the median, the total — describes the 7 rows carrying traffic today: an unopened bore cannot hold a record. Road tunnel lengths are measured portal to portal along the carriageway.
The entries sum to roughly 6.1 km of bore, an average of about 0.87 km each, though that average describes no actual row. 2 of the 7 entries fall within a quarter of the median length, which is how tightly this particular list clusters around its typical structure.
Questions about Denmark
What is the longest road tunnel in Denmark?
On the figures recorded here it is Drogden, at 3.52 km, opened in 2000. It heads a table of 10 entries ordered by bore length, not by span, cost or construction difficulty.
How many road tunnels are listed for Denmark?
10 entries with a recorded length appear on this page, of which 7 carry traffic today and 3 are under construction or planned. The 7 in service run from 0.18 km at the short end to 3.52 km at the top, with the middle of the set around 0.46 km.
How far back do the opening dates go?
The earliest dated entry opened in 1969 and the most recent in 2000, so this page covers 31 years across 4 distinct opening years. A date here is the opening to traffic, which on these 6 dated rows is one to two years after breakthrough.
What is a typical length among the road tunnels listed for Denmark?
The median entry measures 0.46 km and the middle half of the table runs from 0.29 km to 0.7 km. The headline figure of 3.52 km is the outlier, not the norm, which is why the median is the more useful number when comparing one national list against another.
When were most of the road tunnels in Denmark built?
The busiest decade recorded here is the 1960s, with 2 openings, then the 2000s with 2, and 2 of the dated entries opened from 2000 onwards. That is 33 per cent of the 6 dated rows in a single decade, which says as much about when the route was funded as about the engineering.
Other pages in this section
Cite this page
Road Tunnels in Denmark — Complete List by Length. The World's Longest Tunnels. https://www.lotsberg.net/data/danmark/list.html
Related record tables
- Road Tunnels in Bosnia and Herzegovina — 63 Listed by Length
- Road Tunnels in the United Kingdom — 53 Listed by Length
- Road Tunnels in the United States, Part 000
- Road Tunnels in the United States: Full List by Length
- Road Tunnels in Andorra — 6 Listed by Length
- Road Tunnels in Argentina — 8 Listed by Length
- Road Tunnels in Australia — 38 Listed by Length
- Road Tunnels in Austria, Part 000 — 183 Listed by Length
- Road Tunnels in Austria, Part 250 — 109 Listed by Length
- Road Tunnels in Austria, Part 500 — 100 Listed by Length
- Road Tunnels in Austria — 116 Listed by Length
- Road Tunnels in Belgium — 67 Listed by Length