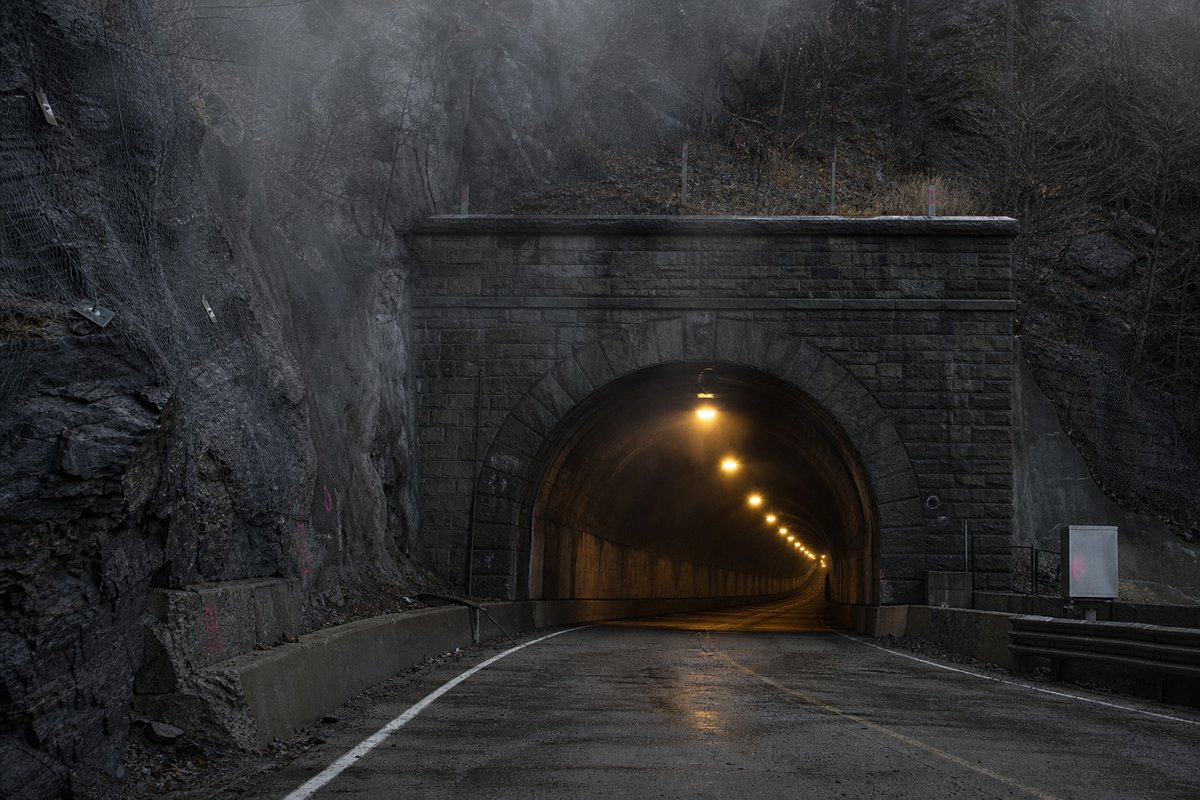
The ordering gives road tunnels in the united states by length, which is the comparison most readers arrive wanting. They are not uniform: the fullest runs to 18 words and the briefest to 6, and on a page of this kind the long ones are where the explanation lives — the caption carries what the picture cannot.
The tail of the distribution is where most of the engineering interest sits, which is why nothing is trimmed from the bottom of the list. A list of road tunnels in the united states is only as good as its sourcing, and each figure here comes from an operator or an administration.
What follows is a list of road tunnels in the united states and not a selection, with every row traceable to a published source. The median entry measures 1.57 km, so half the table sits below that and half above, which is a better guide to the typical structure here than the headline figure.
- 56entries listed
- 4.18 kmlongest bore
- 1904–2016openings span
- 85.51 kmtotal length
The road tunnels in the united states, ranked by length
How this archive measures: lengths, bores, dates and ordering
| State | Tunnel | Length (m) | Date of opening | State | Comment | Road |
|---|---|---|---|---|---|---|
| USA | Whittier (Anton Anderson Memorial) | 4 184 | 07.06.00 | AK | Road and railway tunnel. Whittier city | |
| USA | LBJ | 3 000 | 2016 | TX | Second tube: 2400 m | I-635 |
| USA | Brooklyn Battery | 2 779 | 15.05.1950 | NY | Second tube: 2779 m. East River. NYC | I-478 |
| USA | Eisenhower Memorial | 2 731 | 21.12.1979 | CO | Second tube: 2725 m (08.03.1973). East portal 3401 m above sea level. World's highest road tunnel. | I-70 |
| USA | Holland | 2 608 | 13.11.1927 | NY-NJ | Second tube: 2551 m. Hudson river. NYC | I-78 |
| USA | Ted Williams | 2 575 | 15.12.1995 | MA | Also named 3rd Harbour. Immersed tunnel, City Boston | I-90 |
| USA | Lincoln Center | 2 504 | 22.12.1937 | NY | Hudson River. NYC | 495 |
| USA | Lincoln South | 2 440 | 25.05.1957 | NY | Hudson River. NYC | 495 |
| USA | Thomas O'Neill Jr. | 2 400 | 29.03.2003 | MA | Part of Boston Big Dig. Second tube: 2400 m (20.12.2003). Immersed tunnels | I-93 |
| USA | Baltimore Harbour | 2 332 | 29.11.1957 | MD | Second tube: 2332 m. Immersed tunnels | I-895 |
| USA | Hampton roads | 2 280 | 1976 | VA | Immersed tunnel (-33 m). Second tube: 2280 m | I-64 |
| USA | Lincoln North | 2 281 | 01.02.1945 | NY | Hudson River. NYC | 495 |
| USA | Fort Mc Henry | 2 184 | 23.11.1995 | MD | Second, third, fourth tube: 2184 m each. Immersed tunnel, 2 lanes each. Baltimore | I-95 |
| USA | Sideling Hill | 2 067 | 01.10.1940 | PA | Abandoned on 26.11.68 | I-76 |
| USA | Wacker Dr. | 2 025 | IL | City Chicago | ||
| USA | Queens Midtown | 1 955 | 15.11.1940 | NY | Second tube: 1912 m. East River. NYC | 495 |
| USA | Allegheny | 1 850 | 01.10.1940 25.08.1966 | PA | Second tube: 1850 m (15.03.65). Penns. Turnpike | I-76 |
| USA | Thimble Shoal | 1 749 | 15.04.1964 | VA | Immersed tunnel. Chesapeake Bay | US13 |
| USA | Liberty | 1 734 | 01.1924 | PA | Second tube: 1734 m. Pittsburgh | I-579 |
| USA | Sumner | 1 725 | 1934 | MA | Immersed tunnel. Boston. Opposite to Callahan tunnel | 1A |
| USA | Zion | 1 711 | 1930 | UT | 9 | |
| USA | Chesapeake Channel | 1 653 | 19.04.1999 | VA | Second tube: 1 651 m (15.04.1964). Immersed tunnel, Chesapeake bay | US13 |
| USA | East River Mountain | 1 646 | 20.12.1974 | VA - WV | Second tube: 1646 m | I-77 |
| USA | Tuscarora Mountain | 1 623 | 01.10.1940 | PA | Second tube: 1623 m (20.11.68). Penns. Turnpike | I-76 |
| USA | Trans Koolau (Tetsuo Harano) | 1 574 | HI | Second tube: 1520 m | H3 | |
| USA- CDN | Detroit - Windsor | 1 564 | 03.11.1930 | MI | Immersed tunnel (-22,8 m). In USA: 502 m | 401 |
| USA | Callahan | 1 545 | 1961 | MA | Immersed tunnel. Boston. Opposite to Sumner tunnel | 1A |
| USA | Monitor Merrimac Memorial | 1 463 | 04.1992 | VA | I-664 | |
| USA | Kittatinny Mountain | 1 441 | 01.10.1940 | PA | Second tube: 1441 m (20.11.68) Penns. Turnpike | I-76 |
| USA | Laurel Hill | 1 384 | 01.10.1940 | PA | Abandoned on 30.10.64 | I-76 |
| USA | Lehigh | 1 360 | 01.10.1940 | PA | Second tube: 1335 m (22.11.91). Penns.Turnpike | I-76 |
| USA | Alameda | 1 341 | PRJ | CA | Bid year: 2001 | |
| USA | Blue Mountain | 1 323 | 01.10.1940 | PA | Second tube: 1323 m (20.11.68) / Penns. Turnpike | I-76 |
| USA | Cumberland Gap | 1 298 | 1996 | TN - KY | US25E | |
| USA | Wavona | 1 290 | CA | Yosemite | RT41 | |
| USA | Big Walker Mountain | 1 289 | 23.06.1972 | VA | Second tube: 1289 m | I-77 |
| USA | Squirrel Hill | 1 288 | 05.06.1953 | PA | Second tube: 1288 m. Pittsburgh | I-376 |
| USA | Midtown ( 2 nd Norfolk Portsmouth) | 1 278 | 06.09.1962 | VA | Immersed tunnel (-27 m) | US58 |
| USA | Devil’s Slide | 1 219 | 26.03.2013 | MT | Second tube: 1219 m (Tom Lantos tunnels) | US1 |
| USA | A9 / 1* | 1 219 | PRJ | NC | Bid Year: 2007 | |
| USA | Hanging Lake | 1 219 | 1992 | CO | Second tube: 1219 m | I-70 |
| USA | Downtown (1 st Norfolk Portsmouth) | 1 162 | 04.03.1987 | VA | Second tube: 1021 m (23.05.52). Immersed tunnel (-25 m) | I-264 |
| USA | Washburn | 1 147 | 1950 | TX | Immersed tube with two lanes under Houston Ship Channel | |
| USA | Lake Shore | 1 125 | IL | City Chicago | ||
| USA | Wabash | 1 115 | 27.12.1904 | PA | Under Mt. Washington, Pittsburgh. Rail tunnel till 1946 | |
| USA | Caldecott 1 & 2 | 1 102 | 07.04.1982 | CA | Second tube: 1100 m | CA24 |
| USA | Fort Pitt | 1 097 | 01.10.1960 | PA | Second tube: 1097 m. Pittsburgh | I-279 |
| USA | Posey | 1 081 | 27.10.1928 | CA | Opposite to Webster tunnel | US24 |
| USA | Ray’s Hill | 1 077 | 01.10.1940 | PA | Abandoned on 26.11.68 | I-76 |
| USA | I 95 - Mall | 1 036 | 1973 | DC | Second tube: 1036 m | |
| USA | Bankhead | 1 033 | 20.02.1941 | AL | Town Mobile, under Mobile River | US98 |
| USA | Caldecott 3 | 1 027 | 07.04.1982 | CA | CA24 | |
| USA | Webster | 1 021 | 27.10.1928 | CA | Opposite to Posey tunnel | US24 |
| USA | Port of Miami | 1 021 | 05.2014 | FL | Second tube: 1021 m. Miami harbour | |
| USA | Mt. Baker | 1 006 | 1940 | WA | Second tube: 1006 m (1940); third and fourth tubes: 1006 m (1991) | I-90 |
| USA | Michigan Av. | 1 005 | IL | City Chicago |
| — | State | Main Town |
|---|---|---|
| MT | Montana | Helena |
| NE | Nebraska | Lincoln |
| NV | Nevada | Carson City |
| NH | New Hampshire | Concord |
| NJ | New Jersey | Trenton |
| NM | New Mexico | Santa Fe |
| NY | New York | Albany |
| NC | North Carolina | Raleigh |
| ND | North Dakota | Bismarck |
| OH | Ohio | Columbus |
| OK | Oklahoma | Oklahoma City |
| OR | Oregon | Salem |
| PA | Pennsylvania | Harrisburg |
| RI | Rhode Island | Providence |
| SC | South Carolina | Columbia |
| SD | South Dakota | Pierre |
| TN | Tennessee | Nashville-Davidson |
| TX | Texas | Austin |
| UT | Utah | Salt Lake City |
| VT | Vermont | Montpelier |
| VA | Virginia | Richmond |
| WA | Washington | Olympia |
| WV | West Virginia | Charleston |
| WI | Wisconsin | Madison |
| WY | Wyoming | Cheyenn |
Measuring length, and why sources disagree
The table below lists 56 entries with a recorded length, each giving a name, a length in metres and, where documented, the year of opening. The middle half of the table runs from 1.12 km to 2.21 km, and that band is where most of the engineering on this page actually sits.
The shortest recorded entry is 1.01 km against 4.18 km at the top, a spread of 4.16x across the same table. The three longest entries alone account for 9.96 km of the 85.51 km on this page, which is 12 per cent of the total from 3 of 50 rows.
Opening dates are given for admission of traffic, not for breakthrough. 6 of those 56 are recorded as under construction or planned, the longest of them measuring 1.36 km, so the count includes them while every measured figure — the range, the median, the total — describes the 50 rows carrying traffic today: an unopened bore cannot hold a record.
This page records the road tunnels catalogued for the United States in a tunnel almanac maintained at this address since the late 1990s. Lengths for the United States are recorded in metres which is how the operators publish them and why the shortest entry here reads as 1 005 m and not a rounded figure.
25 entries sit above the median and 25 at or below it, so the table is evenly weighted and not clustered at one end. Where one of these 50 lengths disagrees with an operator's own figure for the United States, the table keeps the published value and notes the difference instead of averaging the two.
Why the list is complete rather than a top ten
A new scheme in the United States would have to beat 4.18 km to change the head of this table, and that is the figure worth rechecking when one opens. Dates for the United States refer to opening to traffic, not breakthrough, so the 1904 entry was under construction for some years before that.
Between the longest and the tenth-longest the drop is 1.85 km, which is the part of the table that changes when a single scheme opens. The 50 rows for the United States are ordered by length, not by date, so the 2016 opening sits well down the table without being any less current.
The entries sum to roughly 85.51 km of bore, an average of about 1.71 km each, though that average describes no actual row. The longest entry is 4.2 times the shortest and 2.7 times the median, which is the quickest measure of how uneven the table is.
20 of the 50 entries fall within a quarter of the median length, which is how tightly this particular list clusters around its typical structure. 3 of the dated entries opened from 2010 onwards, which shows how much of what is listed here is recent construction and not historic work.
Opening dates and what they refer to
The shorter half of the table totals 29.9 km against 55.61 km for the longer half, from the same number of rows. Eighth on the list is Thomas O'Neill Jr at 2.4 km, which is where the table stops being about record holders and starts being about ordinary infrastructure.
After the 1940s the next busiest decade here is the 1990s with 6 openings, so the building effort came in more than one wave. The dated entries fall across 33 different years, which is a rough measure of whether this was a sustained programme or a handful of separate schemes.
Reading a list of road tunnels in the united states
Roughly 5 of the dated entries opened in this century, which is a rough measure of how much of the network is recent. The ten longest average 2.76 km against 1.45 km for everything below them, and that ratio is the clearest thing this table says about the distribution.
Where a figure could not be sourced the cell is left blank, so what is shown is measured and nothing is inferred. Laid end to end the entries on this page would run 85.51 km, which is a number with no engineering meaning but a useful sense of the scale of what is catalogued.
Dated entries run from 1904 to 2016, and the busiest decade is the 1940s with 12 recorded openings. The table on this page runs to 56 rows and records State, Tunnel, Length (m), Date of opening and State for each of them, which is the shape the original compiler chose rather than one imposed here.
Length is recorded in metres for every entry, and length alone decides the sort order. 52 of the 56 rows carry an entry in the comment column — 93 per cent of the table — and that column is where the qualifications live: tube counts, closures, boundaries and the reason a figure reads the way it does.
Anyone comparing these figures across borders should read the note column too, since national practice varies. Read down the length (m) column, the 56 values run from 1 005 m to 4 184 m with a midpoint at 1 452 m; the spread rather than the maximum is what says how uneven this set is.
The longest stands 1.18 km clear of the next longest, which is the margin to watch when a new scheme is announced. The captions name 14 distinct places and structures — River, Boston and Penns among them — and those names are the index into the length tables where each is recorded with its own figure.
The dated entries carry 33 distinct opening years across 112 years, and the median opening year is 1957. The material on this page is held in 26 captions rather than in running text, 233 words of it, each written against the image or row it belongs to by the compiler who put the page together.
The tunnel column names 56 distinct entries on this page, Whittier (Anton Anderson Memorial) and Brooklyn Battery among them, each traceable to the operator or administration record it was taken from. Span rather than total length is what places a bridge in a record, because the span is the engineering and the approaches are not.
Where two sources disagree on a length, the operator's own published length is preferred. A tunnel list for the United States reads differently from a neighbouring country's: 2 of these 50 structures pass three kilometres, and the same journey time is bought with one long bore in one country and a dozen short ones in another.
This page is the full reference table, not a top ten, and it carries every entry that meets the inclusion rule. Readers who want road tunnels in the united states by length and not a curated shortlist will find exactly that here. The list is complete, not a top ten, so the tail is visible too.
Sorting on that one dimension is imperfect, since geology decides difficulty, but it is the measure published consistently enough to rank on. Treat the table as the argument and the prose as the footnote: the numbers carry the case. A list assembled this way is easier to audit, because every row names its structure.
Opening dates before 1900 are shown as published, since sources frequently disagree. Nothing in this table is estimated: where a value could not be sourced it is left blank. Comparing one national list against a neighbouring one is more informative than reading either alone, since terrain and funding practice differ sharply across borders.
The longest entry is Whittier, at 4.18 km, opened in 2000. Second and third place go to Brooklyn Battery at 2.78 km and Eisenhower Memorial at 2.73 km. The 1940s account for 12 openings here and the 1990s for 6, so the building effort was not spread evenly across the period.
Further down the table, Ted Williams is recorded at 2.58 km and Lincoln Center at 2.5 km. Openings average one every 2.3 years across the dated entries here, though they arrive in clusters, not at that rate. Administrative boundaries have been redrawn in several countries since these lists were first assembled.
Questions about the United States
What is the longest road tunnel in the United States?
On the figures recorded here it is Whittier, at 4.18 km, opened in 2000. It heads a table of 56 entries ordered by bore length, not by span, cost or construction difficulty.
How many road tunnels are listed for the United States?
56 entries with a recorded length appear on this page, of which 50 carry traffic today and 6 are under construction or planned. The 50 in service run from 1.01 km at the short end to 4.18 km at the top, with the middle of the set around 1.57 km.
How far back do the opening dates go?
The earliest dated entry opened in 1904 and the most recent in 2016, so this page covers 112 years across 33 distinct opening years. A date here is the opening to traffic, which on these 49 dated rows is one to two years after breakthrough.
What is a typical length among the road tunnels listed for the United States?
The median entry measures 1.57 km and the middle half of the table runs from 1.12 km to 2.21 km. The headline figure of 4.18 km is the outlier, not the norm, which is why the median is the more useful number when comparing one national list against another.
When were most of the road tunnels in the United States built?
The busiest decade recorded here is the 1940s, with 12 openings, then the 1990s with 6, and 5 of the dated entries opened from 2000 onwards. That is 24 per cent of the 49 dated rows in a single decade, which says as much about when the route was funded as about the engineering.
Other pages in this section
Operators and administrations
- AARoads.com aaroads.com
The single external address listed above was checked against the content of the page it leads to, not merely its status code, and it still holds the material it was listed for.
Cite this page
Road Tunnels in the United States: Full List by Length, Opening Dates. The World's Longest Tunnels. https://www.lotsberg.net/data/USA/list.html
Related record tables
- Road Tunnels in Bosnia and Herzegovina — 63 Listed by Length
- Road Tunnels in the United Kingdom — 53 Listed by Length
- BART Tunnels and Tubes in the San Francisco Bay Area
- Bridges and Viaducts in the United States
- Road Tunnels in the United States, Part 000
- Railway Tunnels in the United States — 5 Listed by Length
- Road Tunnels in Andorra — 6 Listed by Length
- Road Tunnels in Argentina — 8 Listed by Length
- Road Tunnels in Australia — 38 Listed by Length
- Road Tunnels in Austria, Part 000 — 183 Listed by Length
- Road Tunnels in Austria, Part 250 — 109 Listed by Length
- Road Tunnels in Austria, Part 500 — 100 Listed by Length