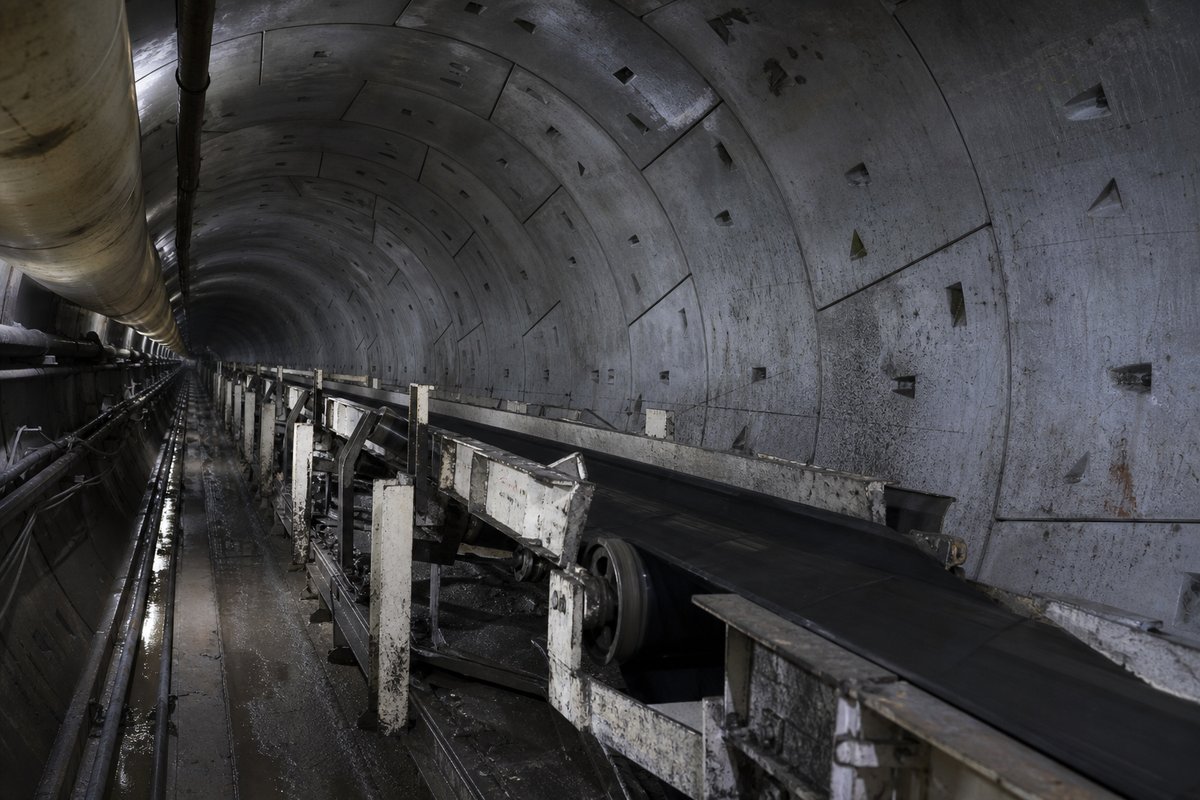
Length is the dimension published most consistently across countries, which is why it usually governs an ordering, but it is a poor measure of difficulty. Geology decides cost and programme far more than distance does, and a short bore in bad ground can outlast a long one in sound rock.
Forecasts on schemes this size move by years. Records in this field move whenever one large scheme opens, and a page that is not re-checked drifts out of date without announcing it. Ventilation type constrains how long a bore can be driven without intermediate shafts, and its absence is often what caps a tunnel's length.
A machine in uniform soft ground can be limited by segment erection rather than by cutting, which caps the daily rate. Where a figure could not be corroborated it was left out. Corrections have historically arrived by letter rather than by form, and that is still how most errors in it have been found.
- 3entries listed
The record table
Advance rates are the figures the industry actually reports, and they are not comparable between projects without the ground conditions attached. Cost per kilometre is deliberately not tabulated: see the text.
How this archive measures: lengths, bores, dates and ordering
| Measure | Figure | Machine or project | Note |
|---|---|---|---|
| Best recorded day | 30 m | Qin Liangyu, Hong Kong | 17.63 m diameter, subsea, in mixed ground |
| Best recorded week | 167.2 m | Qin Liangyu, Hong Kong | Same drive; a weekly figure smooths single-shift peaks |
| Typical range, large diameter soft ground | 10 to 30 m per day | Urban metro and road drives | Segment erection, not cutting, usually sets the pace |
How this table is compiled
Mixed-face ground, where hard rock and soft soil meet across the cutterhead, is the slowest and most damaging condition of all. Cost figures are excluded for a harder reason: currency, inflation and differing project scope make them close to meaningless in comparison. Comparing one country's practice against a neighbour's is more informative than reading either alone.
In hard rock the limit is cutter wear, and changing cutters means stopping the machine and entering the cutting chamber. Cross-passage spacing, fixed firefighting and emergency ventilation control are what modern safety regulation actually governs. Where a structure belongs to two classes it appears on both tables, which is not double counting but two different measurements.
Cost per kilometre is deliberately not tabulated in this archive, and the reason is not squeamishness. Published costs mix currencies, decades, and wildly different scopes: some include stations, portals and approach roads, others only the bore. Twin-tube crossings frequently show two slightly different lengths, because the two carriageways rarely follow the same line through the rock.
Advance rate is the figure the industry reports, and it is close to meaningless without the ground conditions attached. This archive has recorded tunnel data since the late 1990s, compiled from operator publications, national administrations and the engineering press. Traffic figures are excluded throughout this archive, because they date far faster than the structures themselves.
Best-day figures are the ones quoted in press releases; best-week figures are more honest because they include the stoppages. Two projects quoted per kilometre can differ by an order of magnitude without either figure being wrong. Where a cost is genuinely comparable it is recorded in the note column of the relevant project page instead.
Reading the figures
Gradient limits are the main reason railway tunnels run longer than road tunnels on the same crossing. A base tunnel trades a much greater length for a far lower summit altitude and a gentler ruling gradient. Subaqueous tunnels are governed by rock cover above the bore rather than by the depth of water above that.
Reading the qualification before the figure is usually the faster route to understanding what a claim actually says. Figures are checked against one another where sources disagree, and the disagreement is recorded rather than resolved silently. Tunnel engineering is a field where the qualifications attached to a number matter more than the number itself.
The table is short because the sourcing bar is high. Dates use the day, month and year the event occurred. Rows are ordered so that the head of the table answers the question most readers arrive with. The archive grew through correspondence with engineers and administrations in more than twenty countries, and still does.
Disputed values carry the dispute in the note column. Every figure here is traceable to a named source. A contained fire is more instructive than an uncontained one. The date of verification is published with the table. Promoter figures are used where no independent one exists. The note column is worth reading before the number.
Forecast dates are forecasts, and they move. Secondary summaries were not used as a source. Opening year means the year traffic was admitted. Two independent sources were required for each row. Minor incidents are listed alongside the serious ones. Metres are used for structures, kilometres for routes. Deaths are the figures established by official inquiry.
Questions about this record
How fast can a tunnel boring machine advance?
The best recorded day on the largest machine yet built was 30 m, with a best week of 167.2 m. A typical large-diameter soft-ground drive runs 10 to 30 m per day, and segment erection rather than cutting usually sets the pace.
Why is cost per kilometre not listed?
Because published figures mix currencies, decades and completely different scopes. Some include stations, portals and approach roads; others count only the bore. Two projects quoted per kilometre can differ tenfold without either being wrong.
How is this page sourced?
From operator publications, national administrations, official inquiry reports and the engineering press. Every figure was corroborated from at least two independent sources; anything that could not be is left out rather than estimated.
How current is this page?
It reflects the state of the archive at the last check recorded on it. A page of this kind goes out of date when a scheme opens or an inquiry reports, so a figure worth relying on should be read together with the date the page states rather than assumed to be today's.
Other pages in this section
Cite this page
TBM cost and advance rate: what the published figures mean. The World's Longest Tunnels. https://www.lotsberg.net/tunnelling/tbm-cost-and-speed.html
Related record tables
- Tunnel fires and accidents: the incident record
- Fire accidents in road tunnels: the full record
- Railway and metro tunnel accidents: the full record
- How tunnels are built: methods, machines and ground
- Tunnel boring machines: how they work, types and records
- TBM versus drill and blast: how the choice is made
- Tunnels under construction: the project tracker
- Brenner Base Tunnel: length, depth and opening date
- Fehmarnbelt tunnel: the longest immersed tunnel
- Rogfast: the deepest and longest subsea road tunnel
- Mont d'Ambin Base Tunnel: the Turin to Lyon base tunnel
- Atal and Zojila: India's high-altitude highway tunnels